



📞 Call 09 70 44 66 31
⚡ Performance

Why a fast website matters for your business

A slow website does not just lose visitors: it loses customers who will never tell you they came. What speed really changes, and how to check it yourself.

A potential customer finds you on Google from their phone, on an average connection. Their need is specific: an emergency repair, a quote. For three seconds, they stare at a blank screen. Then they go back and tap the next result — your competitor. You will never know they came.

This is the blind spot of most business websites: slowness raises no alarm, it simply shaves away the number of visitors who make it to the end of their visit. The good news is that website performance can be measured for free, in a few minutes, and depends far more on technical choices made at the start than on any budget. It is the foundation of how we approach building fast websites.

Speed is not a technical detail, it is revenue

Bounce: the customer who leaves without a word

The bounce rate is the share of visitors who leave without doing anything beyond looking at the page they landed on. A study published by Google in 2017 on mobile sites found that the probability of a bounce rises by around a third when load time goes from one second to three. Someone looking for a tradesperson on a Sunday evening has three tabs open: the first site to appear gets the call.

Every step of the journey pays for slowness

The home page is only the front door. The real cost is paid along the rest of the path: the service page that is slow to open, the gallery that loads in fits and starts, the button that does not respond straight away. At each of those points, some visitors give up. A fast site does not magically raise your conversion rate: it stops pushing it down.
Core Web Vitals: the three measures Google looks at

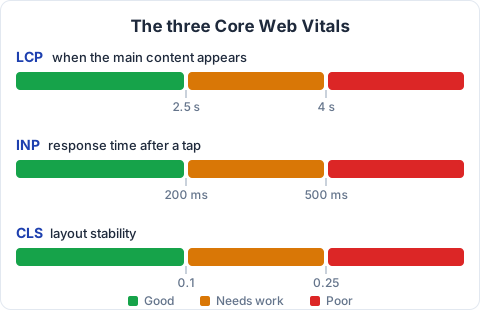
Google has standardised how the loading experience is measured under the name Core Web Vitals: three indicators, each answering a question a real visitor asks. Google does not assess them in a laboratory but from genuine visits, and considers a page good when 75% of visits meet the threshold. So being fast from your own office on fibre is not enough.

LCP

Largest Contentful Paint

The delay before the largest visible element appears — the main photo, the heading block. The moment the visitor finally sees something useful.

Good: 2.5 seconds or less.

INP

Interaction to Next Paint

The delay between a visitor's action (a tap, a menu press) and the page visibly responding. It replaced the FID indicator in March 2024.

Good: 200 milliseconds or less.

CLS

Cumulative Layout Shift

Visual stability: how much the content moves while the page loads. It is the button that shifts at the exact moment your thumb comes down.

Good: 0.1 or less.

The thresholds for Google's three Core Web Vitals. LCP is good up to 2.5 seconds and poor beyond 4 seconds; INP is good up to 200 milliseconds and poor beyond 500; CLS is good up to 0.1 and poor beyond 0.25.
Between green and red sits a middle zone: a page can need work without feeling slow.

CLS is the sneakiest of the three, because it never shows up in a screenshot. Its causes are well known: images published without declared dimensions, a banner inserted after the fact, a font that arrives late and reflows the text.

Google ranks fast sites higher

Since 2021, page experience has officially been part of the signals the search engine uses. Let us be precise, because this point is often overstated: Google repeats that content relevance comes first, and a slow page that answers the exact question asked will outrank a fast, empty one.

Between two equally relevant pages, though — the everyday situation of a tradesperson facing competitors in the same town — speed is what separates them. It also works indirectly, since a fast site is crawled more efficiently by indexing robots. Search engine optimisation is won by accumulating such advantages, and performance is only one of them: the others are covered in our article on the SEO mistakes that hurt a website.

Why a static site is structurally faster

What a database-driven site does on every visit

On a site built around a traditional content management system — WordPress, Drupal, PrestaShop — every visit triggers a small building project on the server. A PHP program starts up, queries a database for the text, the menus and the settings, runs the code of every installed plugin, assembles it all into HTML, then sends the result. That work is redone for every visitor and every page.

These tools are not bad: they are designed for sites whose content changes by the minute, a shop with stock levels, a publication with dozens of contributors. But a brochure site whose pages change a few times a year pays for that machinery without ever getting the benefit.

What a static site does

A static site reverses the order of operations: the HTML pages are generated once, when they are published. What sits on the server afterwards are finished files. When a visitor asks for a page, there is no database query, no PHP to run, no plugin to wake up: the file is sent as it is. You cannot speed up work that never happens.

Two secondary benefits follow: there is no database to breach and no plugins to update in a hurry, and hosting costs a fraction of an application server. Our services are built entirely on this architecture.

CDN and images: the two levers that change everything

A CDN, or the end of pointless miles

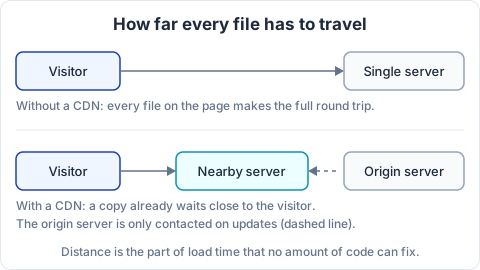
Data does not travel instantly. If your site sits on a single server and a visitor opens it from the other end of the country, every element on the page makes the round trip. A CDN (content delivery network) places copies of your pages in hundreds of points of presence: a visitor in Manchester is served from a server close to them. The sites we build are distributed across more than 300 points of presence, because distance is the part of load time that no amount of code optimisation can fix.

Without a CDN, every file on the page makes the full round trip between the visitor and the site's single server, often very far away. With a CDN, a copy of the page already waits on a server near the visitor, and the origin server is only contacted when the site is updated.
The same trip for every file: images, fonts, style sheets.

Images: the biggest weight on a page

In the vast majority of slow sites we audit, the culprit is the same: photos published exactly as they came off a phone, weighing several megabytes, displayed in a frame a few hundred pixels wide. Four habits settle the matter:

  • Resize before publishing. An image displayed at 600 pixels wide has no business being 4,000.
  • Use modern formats. WebP and AVIF cut the weight substantially at the same visual quality, and every current browser supports them.
  • Declare the dimensions. Stating width and height reserves the space before loading: the direct remedy for CLS.
  • Defer what is not visible. Lazy loading avoids downloading images further down the page until the visitor scrolls to them.

The same principles apply to the rest: compression, fonts hosted on the site, and above all restraint with scripts. Every external widget — chat, map, counter — is one more third-party server whose speed and availability you do not control. You can judge the result for yourself in our portfolio.

Test your own site in five minutes

None of this asks you to take our word for it. Three free tools are the references: PageSpeed Insights, published by Google, which shows both a laboratory score and real visitor data; GTmetrix, which breaks the load down element by element; and Pingdom, useful for testing from different countries. Type their name into a search engine, paste your address, and read.

  • Test on mobile first. It is the harsher tab, and the one that matches most of your visitors.
  • Tell the laboratory from the field. The score out of 100 is a simulation; the Core Web Vitals shown above it come from real visits. Those are the ones that count for Google.
  • Do not chase a perfect 100. Going from 45 to 90 changes everything for your visitors; the last few points are a competitive sport.

We apply to our own sites exactly what we describe here: they regularly score 95 to 100 out of 100 on PageSpeed Insights, loading in under a second. The screenshots and the point-by-point comparison with a conventional site are on our pricing page: take the address of any of our sites and check for yourself.

In short

Speed is not a developer's vanity project: it is the first filter every visitor your ranking brought you either passes or fails. Core Web Vitals measure it, free tools confirm it, and the architecture chosen at the start decides almost everything else.

How long does your site take to appear?

We will test it for free and tell you what is slowing it down, in plain words and with no commitment.

Request my free analysis